.png)

.png)


Causal Decision Diagrams (CDD)
“Many decisions made by large organizations, and society as a whole, have reached a level of complexity that has outgrown the capabilities of informal decision making processes. The stakes have become too high, and the game is now played too fast for relying on intuition and luck alone. We need a system that gives us the best chance of winning.” - “Link”, Lorien Pratt
We hear a lot of emphasis today on “data-driven decisions”. In a complex world, this is seen as a methodical approach that can bring scientific analysis to counter ill-informed intuitive decisions. But leading with data can create problems of its own. In many cases, an early emphasis on the data will put the cart before the horse.
She observed two negative patterns in complex decision-making, and then introduced the Causal Decision Diagram (CDD) to help organizations address these problems and improve their decision making.
The first negative pattern she saw was that when leaders drove their decision making efforts with data collection and analysis, the available data then framed the decision. She argues that much of the data ends up being irrelevant to the main factors in the decision, but this is hard to see when the data is the star of the show.
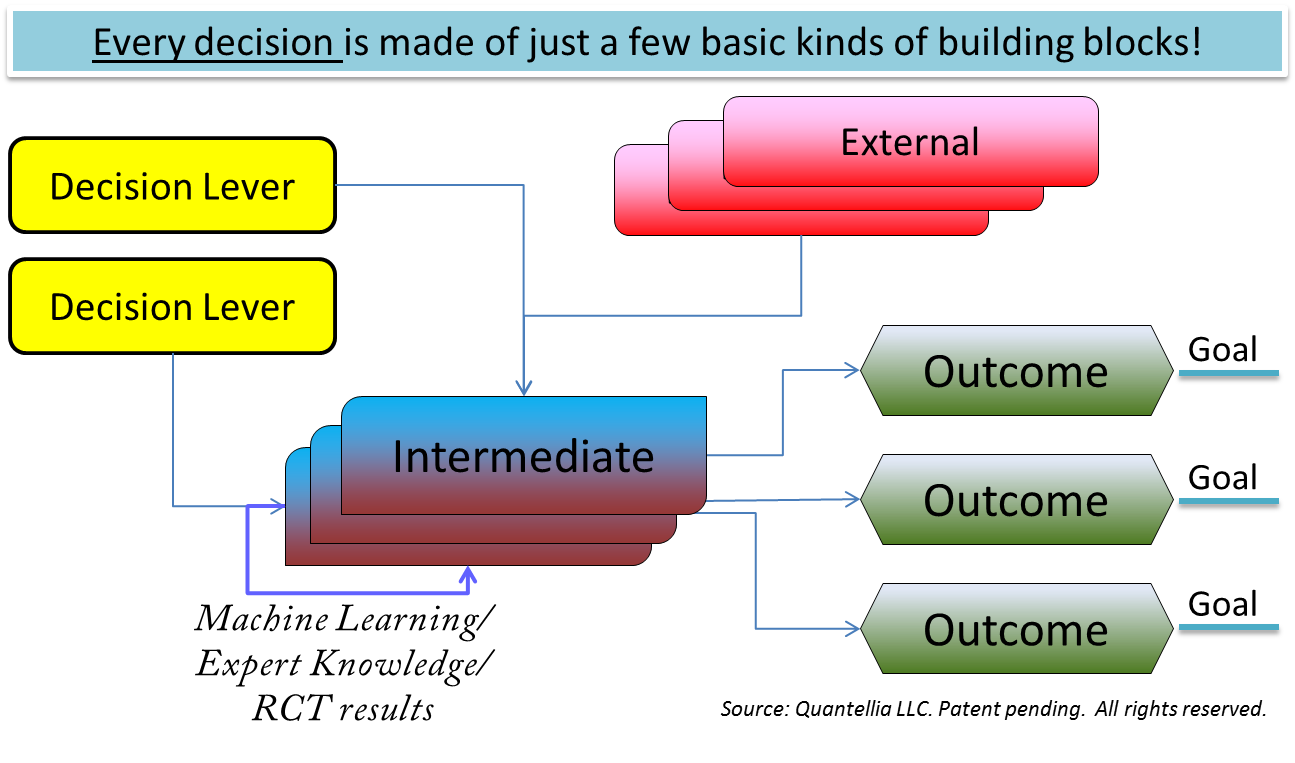
The second negative pattern was the absence of a simple visual language for decision making. While she observed some common key elements that people use to describe decisions in complex environments, there was no way to visualize them together:
- Options or choices
- Outcomes
- Goals
- External factors and constraints
- Cause-and-effect relationships
- Intermediate results
The Causal Decision Diagram is an artifact built by a group of people in support of a complex decision. This technique approaches decision making as an engineering discipline, but at the same time, acknowledges that the output will always be imperfect and incomplete. Its sole intent is to support better decision making.
The CDD is best suited for decision making in complex environments. What constitutes a complex environment? In business settings today, the pace of change in both technology and macro-economic conditions brings complexity into many strategic decisions. Other signs of complex environments include situations:
- Where feedback loops dominate the impact of decisions
- Where “soft” cause-and-effect links (like customer satisfaction) aren’t taken as seriously as “hard” factors (like dollars) - yet should be…
A CDD helps a leadership team address complexity by creating a visual language that:
- Shifts in cognitive load from “having to remember everything”, to “getting creative”
- Supports a shared understanding across decision makers and stakeholders
- Enables a better understanding of how and where AI/ML systems (and their predictions) can support decision making
- Exposes the need for data, instead of letting the available data drive the conversation
To apply the CDD technique to your next complex decision, try out this facilitated approach, over a half- or full-day workshop:
Decision-modeling steps:
1. Setup - Form a cross-functional, diverse-skilled decision modeling team for the exercise.
2. Starting the Meeting - Start with a simple statement of the decision you are facing (i.e. field the executive sponsor’s suggestions and constraints).
3. Brainstorming outcomes - “What are you trying to achieve with <this decision>?” (tangibles and intangibles)
4. Brainstorming levers - Collect ideas for the choices that can be made to achieve the outcomes
5. Analyzing levers - Classify as a true lever or an external (“do we have control over it?”); ask “how?” to improve descriptions of levers (the “how chain”)
6. Analyzing outcomes and goals - Ask “why?” to improve descriptions of goals and outcomes (the “why chain”) and set a decision boundary when outcomes stretch beyond scope of team’s decision authority
7. Brainstorming externals and information sources - “What factors from outside of your organization might influence how your decisions lead to outcomes?”; capture assumptions and identify possible alternative scenarios to run
8. Wiring up the model - “What chain of events from actions to outcomes do you think will have the biggest impact on your goals?”
- Breadth-before-depth: cover the full causal chains left-to-right before going deep
- Determine role for machine learning: discuss where predictions could help case for causality
- Find feedback loops: draw the loops on the diagram
- Identify more intangibles: those key outcomes that can’t be easily measured
- Conduct sensitivity analysis: What missing pieces of information will have the greatest impact on how actions lead to outcomes?
9. Using the model - The ultimate decision-maker should use the diagram to:
- Be better informed on causality
- See new opportunities to use data and AI/ML
- Avoid unintended consequences
- Acknowledge uncertainty (since a CDD will always be imperfect/incomplete)
Remember, the success criteria for this decision-support exercise is only to equip the decision maker with better information than they would have otherwise (i.e. relative to the baseline of their current approach). And from what many executive surveys are telling us, the bar is pretty low today.
One more subtle point - it is crucial that the exercise leverages language familiar to the people doing it. This is about collecting a diverse set of inputs around the decision, and developing a shared understanding of the options. This is not the time or place to learn new terms or ideas. But it’s likely that the activity will uncover learning opportunities along the way!
The key takeaway here is that it’s better to organize information around the decision to be made, than around the data surrounding the decision (much of which may be irrelevant). To that end, the CDD technique can create a powerful visual representation of the causal relationships in a decision-to-be-made. Consider adding it to your organization's decision architecture as you seek ways to create better scaffolding between technology/data and the human decision makers.

.png)